Residential remodeling activity is not distributed equally, and some parts of town receive more than their fair share. Of course, homes in more intensively remodeled neighborhoods tend to be in better shape and to tout the most upgrades both inside and out. As a result, players in the know – buyers, sellers, renters and landlords – all set their expectations for properties accordingly. So where in San Francisco are upgraded homes just par for the course, and where do they stand out? To find out, we turned to the data.
The following map shows the relative intensity of remodeling activity across San Francisco, with darker areas indicating neighborhoods being more intensively remodeled.[1]
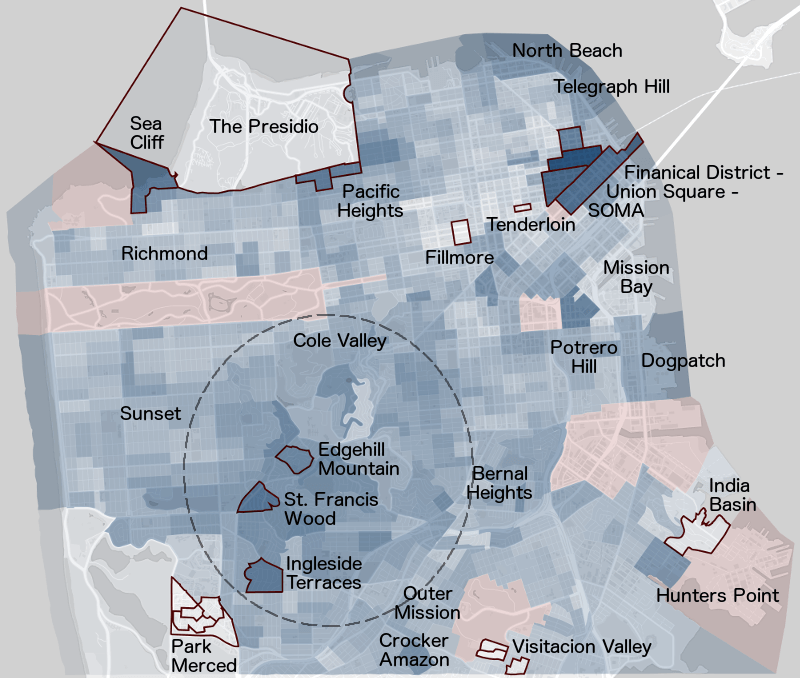
Clockwise starting from the top-left, the notoriously affluent enclaves of Sea Cliff and Pacific Heights show up as hotspots of home improvement, as do North Beach and Telegraph Hill. The most intense hotbed of renovation flanks Market Street on either side, along the stretch facing the Financial District and Union Square on the north and the swath of SOMA from the Embarcadero to Yerba Buena Gardens on the south. At 3 o’clock, the Dogpatch is yet another focal point of activity, as is the area north of Potrero Hill between 7th and 16th streets, both of which are probably influenced by the mass of non-residential construction in nearby Mission Bay. Bernal Heights and the western end of Hunters Point at 4 o’clock are additional home improvement hotspots, as well as Crocker-Amazon at 6 o’clock.
The largest cluster of remodeling activity, though, is the one spanning the hilltop and valley neighborhoods from Cole Valley in the north to the Outer Mission in the south. Homes in these neighborhoods are being remodeled at a faster pace than in most other parts of the city. In contrast, homes in the Richmond and Sunset districts are being kept up at a more subdued pace, as are homes in most of the neighborhoods in the south east quadrant of the city. Remodeling activity appears least intense in the area between the Tenderloin and the Western Addition.
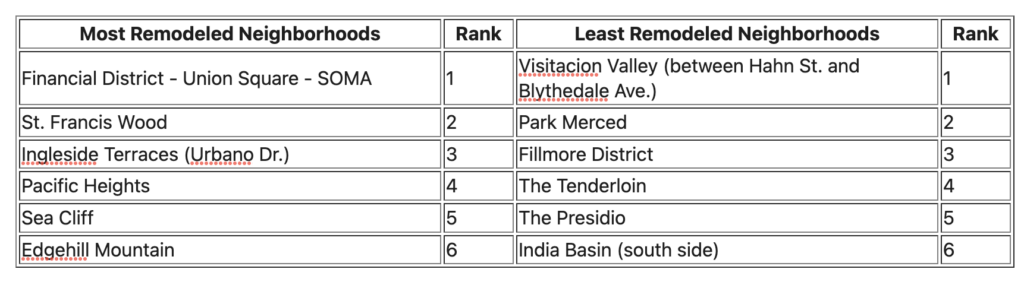
Below are the 6 most and 6 least remodeled neighborhoods in San Francisco.[2]
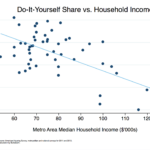
What do the areas seeing the most remodeling have in common?
The numbers show that, on average, the residents of neighborhoods which see more remodeling are wealthier and tend to own their homes rather than renting them. We estimate that:[3]
- An increase of one standard deviation in a neighborhood’s household income corresponds to a 27% rise in remodeling activity.
- An increase of one standard deviation in a neighborhood’s share of renters corresponds to a 22.5% drop in remodeling activity.
- In contrast, an increase of one standard deviation in a neighborhood’s median age of buildings corresponds to just a small increase of less than 3% in remodeling activity.
- Household income and the share of renters alone account for about 1/3 of differences across neighborhoods in the rate of exterior and interior remodeling, and more than 1/2 of the differences across neighborhoods in the rate of home maintenance. Once household income and the share of renters are accounted for, the age of buildings in a neighborhood contributes very little explanatory power.
It is no mystery why wealth and owner-occupancy are such good determinants of remodeling activity. Home improvement is no different than most other consumption goods in that wealthier people tend to consume more of it, and it is hardly surprising that homeowners are likelier to remodel the homes in which they live than the homes which they rent out. Even if we ignore homeowners’ natural inclination to spend more on their own homes than on others’, homeowners tend to live in the same home much longer than renters do, and it makes more sense to customize a home when you plan on being there for longer. We’ve written more on the relationship between remodeling and rent in the past.
The rules regarding remodeling activity and renters
The relationship between owner-occupancy and home improvement does not stem merely from the fact that incomes tend to be lower in neighborhoods with higher shares of renters. Even holding income fixed, an increase of one standard deviation in a neighborhood’s share of renters still corresponds to a 16% drop in remodeling activity.
The map below shows how the share of renters varies across San Francisco, with darker areas indicating a higher share of renters. Together with the remodeling map above, the map illustrates just how stark the connection is between remodeling the share of renters.
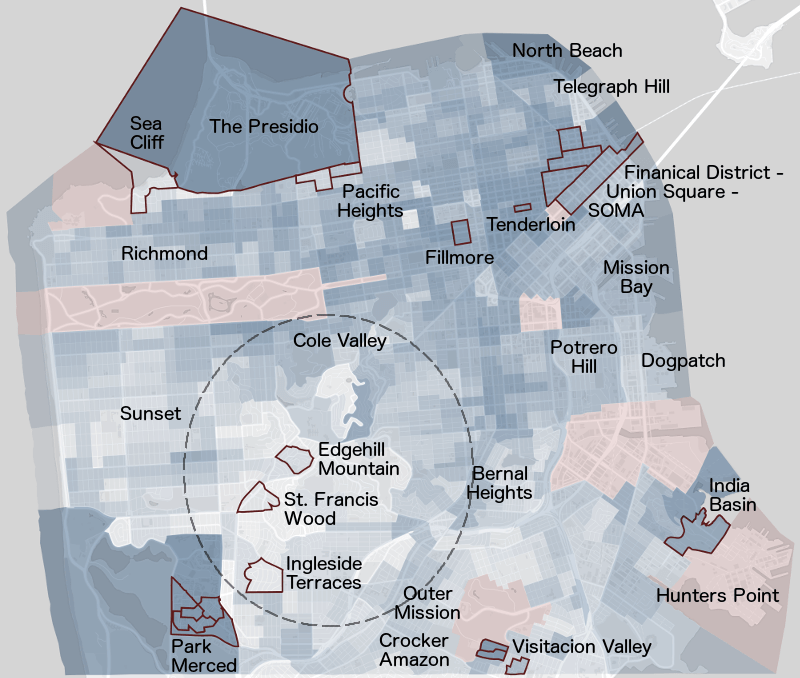
In most areas, the two maps appear to be the inverse of one another, with high renter share areas showing low levels of remodeling activity and vice versa. This is clearly the case for the large cluster of hilltop and valley neighborhoods in the southern-central portion of the city, which are predominantly owner-occupied and which contrast sharply with the predominantly renter-occupied neighborhoods to the southwest, around Lake Merced. Similarly, the northern half of the city tends to have a high share of renters, and against this backdrop Sea Cliff and Pacific Heights show up as islands of high owner-occupancy.
Breaking the rules
Exceptions to the rules are the most interesting. The Financial District – Union Square – SOMA cluster shows up as the most intense hotbed of remodeling activity, but it blends perfectly into its surroundings in terms of its share of renters. This suggests that the factors driving residential remodeling in the area are different than in most other parts of the city, and may be related to a deeper change of the area’s character.[4] The Dogpatch is similar in this respect, though less extreme, and so are the neighborhoods of North Beach and Telegraph Hill, which actually have higher renter shares than their immediate surroundings.
[hr]
Leave a Reply