
he days when you had to build your own home are long gone, but many Americans still pride themselves on doing their own handywork. With roughly 300 billion dollars spent on home improvement last year, there is plenty of work to keep both us and the professionals busy. Doing a project by yourself is estimated to save between 25% and 50%, but doing it yourself requires time and know-how and, let’s face it, it doesn’t always end up looking as nice.
With the American Housing Survey (AHS) at our disposal – a biennial survey of homes conducted by the U.S. Census – we set out to discover what share of maintenance, home improvement and remodeling projects are carried out Do-It-Yourself (DIY), i.e. by homeowners themselves without hiring a professional. After crunching the numbers we learned that Do-It-Yourself accounts for 31.7% projects. We also learned that whether Americans call a pro or roll up their sleeves varies substantially depending on where they live and what they’re setting out to do.
Project types
Only 9.9% of projects involving heating and cooling systems are performed by homeowners. On the other hand, Do-It-Yourself accounts for as much as 49.3% of projects involving exterior structures, like sheds. The average DIY share across all project types was 31.7%. The following chart breaks down the share by project type.
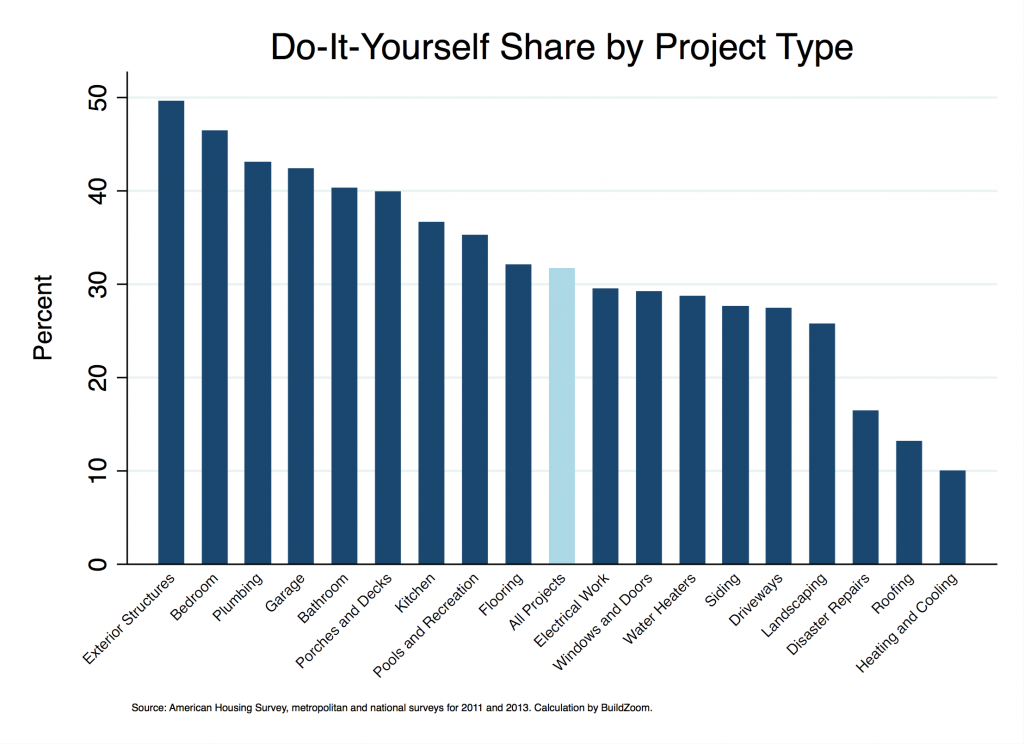
Homeowners tend to hire professionals to do more technical and specialized work, like projects involving heating and electrical work. The same is true of projects that require unique tools, such as siding and driveway repair, as well as projects that are dangerous, like roofing and electrical work.
On the other hand, projects that are more discretionary in nature and less time sensitive are associated with higher Do-It-Yourself shares. Such projects include kitchens, bedrooms and bathrooms, which often contain a strong element of design. Homeowners are more likely to take on tasks that require only basic carpentry know-how and tools, such as flooring, decks and certain exterior structures like sheds and carports. Do-it-yourself cabinetry installation, popularized and made available by stores like Ikea, may also influence the DIY share of certain project types.
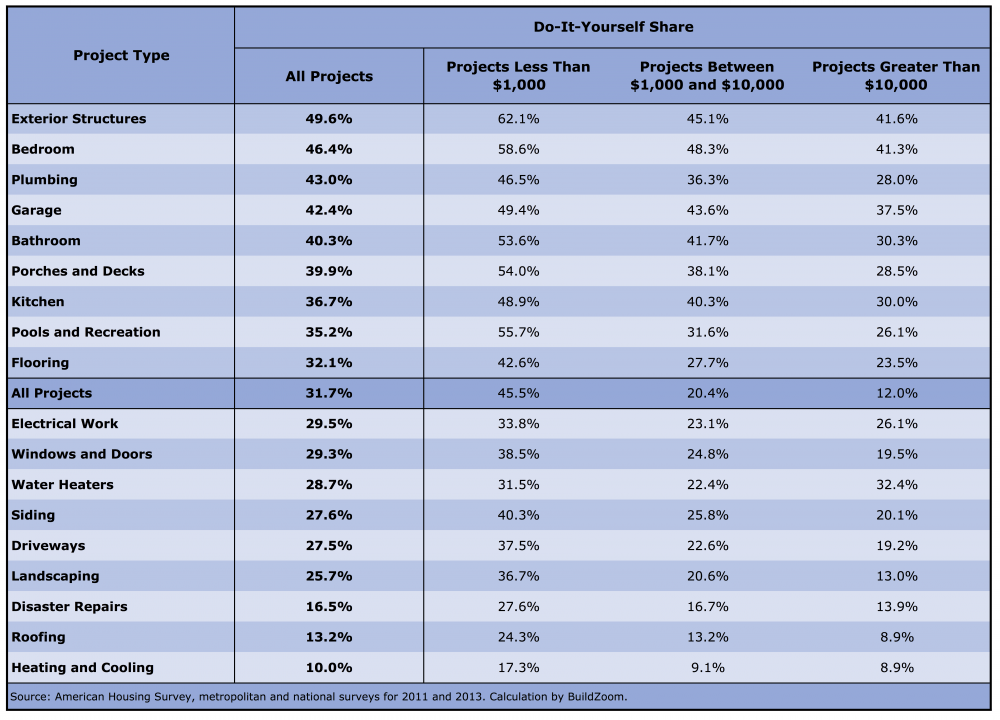
The table below reports the numbers associated with the previous chart, but it also breaks down the DIY shares by project value. With very few exceptions, homeowners are more likely to take upon themselves smaller projects, as evidenced by the decrease in DIY share as project values climb.
Metropolitan areas
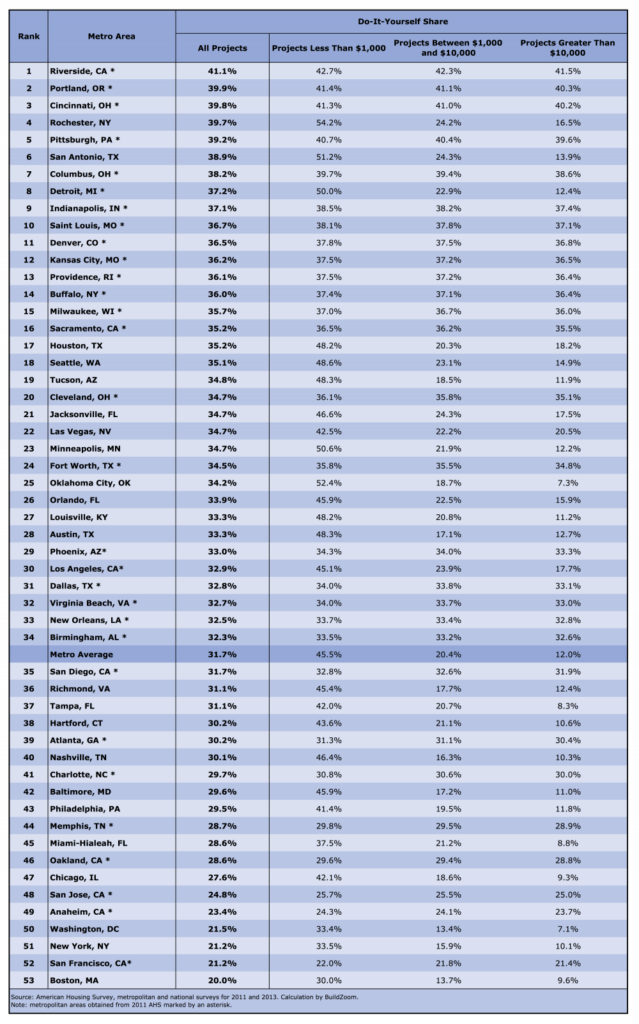
Turning to geography, our analysis shows homeowners in California’s Inland Empire — as the stereotypically blue-collar Riverside-San Bernardino metro area is known — are the likeliest to take on Do-It-Yourself projects, with a 41.1% DIY share. The residents of Portland, Cincinnati, Rochester and San Antonio follow closely behind.
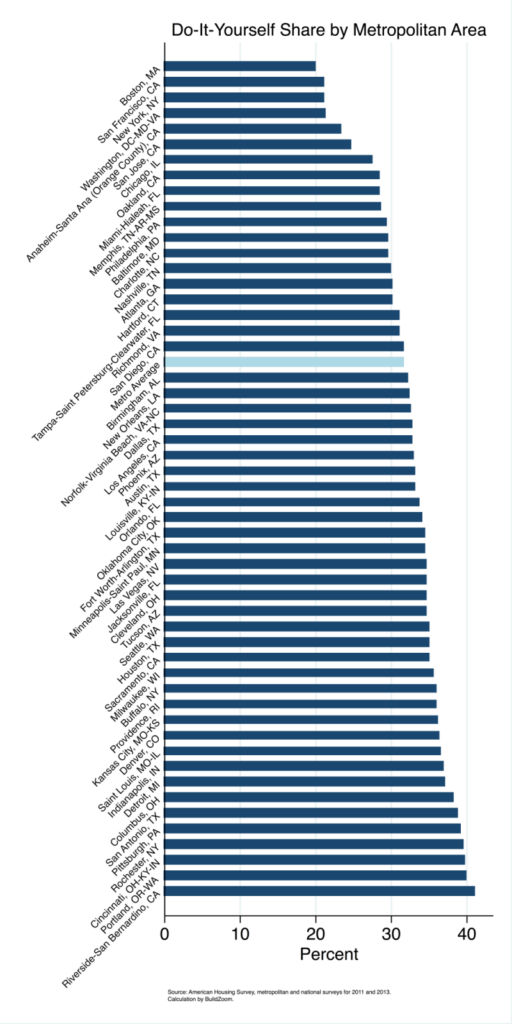
At the other end of the spectrum, Bostonians are the least likely to repair or renovate on their own, with a DIY share of just 20%. Homeowners in San Francisco, New York, Washington D.C., and Orange County, CA, keep Bostonians company at the bottom of this list as they watch the pros work.
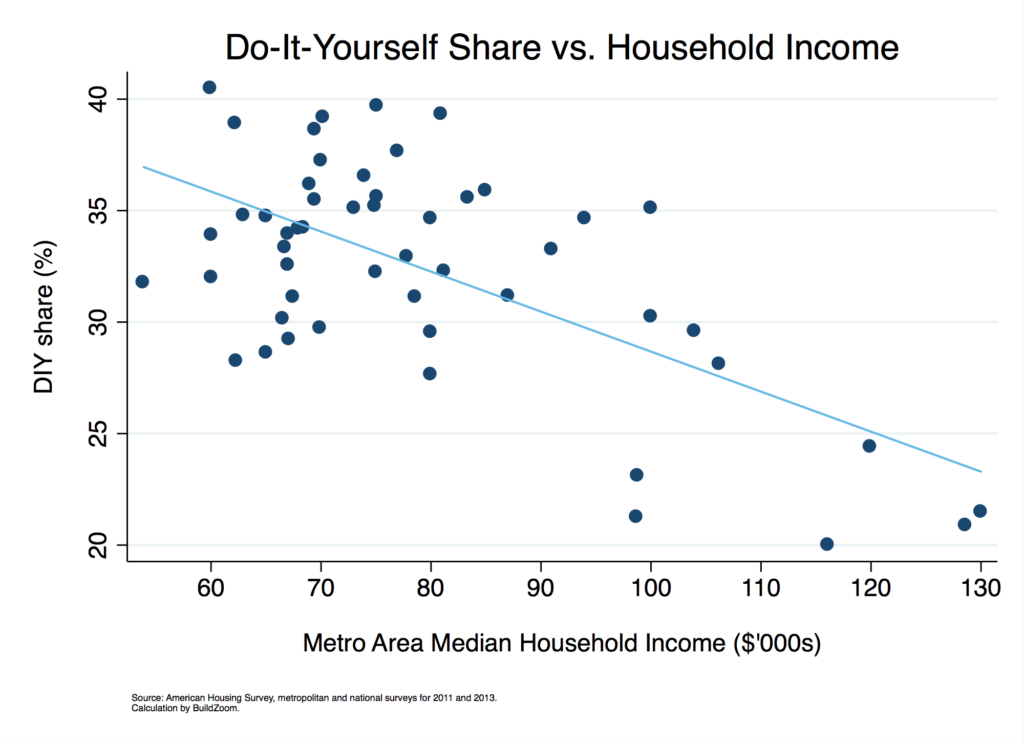
Now that you’ve seen the ranking of metro areas by DIY share, do you suspect that homeowners in higher-income metro areas less likely to take on Do-It-Yourself projects? The answer is yes. The following chart plots each metro area’s DIY share against its median household income, and there is a clear inverse relationship between income and DIY share: homeowners in metros with higher incomes tend to do less work themselves. Although we leave it to the reader to speculate what is causing the relationship, we went ahead and estimated it: a 10,000 dollar increase in income is associated with a 1.7 percentage point decrease in the DIY share. The fitted line in the chart illustrates the estimate.
The table below provides metro area DIY shares, including a breakdown by project value.
Methodology
The analysis uses data on owner-occupied housing units from the 2011 and 2013 editions of the American Housing Survey (AHS). The data were drawn from the AHS metropolitan area files, with the exception of data for New York, Chicago, Los Angeles and Philadelphia, which were drawn from the national files (with appropriate weighting). The metropolitan area definitions used by the AHS are 1980 Standard Metropolitan Statistical Area (SMSA) definitions, which tend to be smaller than current Core-Based Statistical Areas (CBSAs). Projects were assigned to value categories after accounting for inflation. Metro-specific DIY shares for metros observed in 2011 were multiplied by an adjustment factor to account for changes in macroeconomic conditions between 2011 and 2013, which was set as the ratio of the 2013 and 2011 national DIY shares (at a slight cost to accuracy, the adjustment does not account for the shorter sampling period of the 2013 national AHS file, detailed here). DIY shares within project value categories were adjusted for changing macroeconomic conditions using category-specific national DIY share ratios. In all tables, cells with statistics drawn from fewer than 10 sample observations were omitted.

Leave a Reply