Summary:
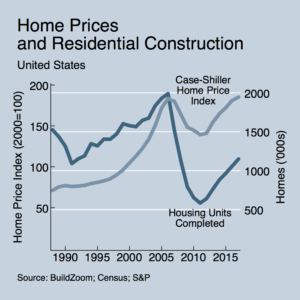
- Even as home prices reach new highs and markets are starved for inventory, the rise in the number of new homes built in the U.S. is sluggish. Homebuilders blame a shortage of labor and, crucially, a limited supply of lots.
- The geography within metros is telling. Home price appreciation in U.S. cities has been substantially greater towards the metropolitan interior, drawing homebuilders to areas in which vacant lots are scarcer, and heightening the perception that lots are in short supply.
- In less costly metros, new housing is reverting to pre-recession growth trends, rebounding primarily at the outer fringe where vacant land is plentiful.
- In expensive coastal cities, slow outward expansion and gradual development within the footprint have depleted the supply of vacant lots. As a result, new housing remains depressed wherever density is taboo – from the interior suburbs right up to metropolitan fringe – but it has rebounded near the center, where dense construction is allowed.
Ten years after the housing bust, home prices are rising to new highs and some parts of the country face a crisis of housing affordability yet, by historical standards, new home construction remains remarkably low. Indeed, the rapid appreciation is often blamed on a shortage of inventory for sale, whose most obvious remedy is new construction.
Ask homebuilders what is holding them back and they will typically surface two complaints: a severe shortage of construction labor and a limited supply of lots. The construction workforce, which took a great hit during the housing bust, is proving difficult to rebuild and is no doubt a crucial factor in determining the industry’s capacity to produce homes, but let’s focus on homebuilders’ difficulty in acquiring lots. Vacant land in the U.S. is hardly scarce – it is only scarce in specific urban places – so what should we infer from homebuilders’ heightened perception of a shortage of lots?
Austin and Traditional U.S. Suburban Growth
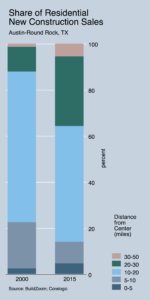
Consider the Austin metro area for example. Over the years, it has provided ample new housing at affordable prices by pursuing an established routine. New development pushes the metropolitan fringe farther into the surrounding hinterland and then gradually, over many years, it fills in the gaps in the developed territory. With few exceptions, Austin consists mostly of low-density development. In the interior, the mosaic of land use has had longer to fill in, development is almost without gaps, and vacant lots are few and far between. Farther out, initial development is more recent and there remain vacant lots and often entire swaths of leapfrogged territory.
The outward progression of the metropolitan fringe and the gradual infill of vacant lots within the developed footprint are both evident in the data (which was courteously provided by Corelogic). In 2000, only 12 percent of residential new construction sales in metro Austin were located more than 20 miles from the center. By 2015 that share had grown to 35.6 percent. However, even in 2015, as much as 59.7 percent were still located in the interior suburbs, between 5 and 20 miles out, reflecting the filling in of vacant lots. A closely related chart depicting the change in residential new construction sales tells the story even more succinctly: in 2015 there were fewer of them 5 to 20 miles out than there were in 2000, but beyond 20 miles the number more than tripled.
But the data also provide a glimpse of something else: homebuilders’ reaction to the rising fortunes of the center. Over the last 25 years the American city center, formerly abandoned to poverty and crime, has turned a sharp corner and become the object of renewed aspiration. Physical, social and economic change near the center has drawn much ink, code, and analysis – too much to dutifully rehash here – but suffice to say that the increase in residential new construction sales within 5 miles of the center, although small in comparison to Austin’s outward growth, is a local manifestation of the urban revival.

One thing Austin makes clear is that urban revival can coexist with vigorous suburban expansion. The more traditional mid-to-late-twentieth-century paradigm that aspires to a greenfield suburban lifestyle is alive and well, as demonstrated by activity at the metro area’s outer fringe, but space to live near its center appears to be in great demand, too.
Expensive vs Expansive Cities

How well does Austin represent the rest of metropolitan America? To answer that, we must distinguish between several types of American cities (by “cities” I mean metropolitan areas). From World War II until the 1970s, U.S. cities provided ample new housing at affordable prices the same way Austin still does, by continually pushing the suburban fringe farther out, and then gradually filling in the gaps. Since the 1970s, though, American cities have diverged into three groups which, in an earlier study, I labeled as either expensive, expansive – with an a – or as legacy cities. Both expensive and expansive cities are prosperous and generate great demand for housing from both current residents and potential new ones. But whereas expansive cities like Atlanta, Houston, and Phoenix have maintained the previous paradigm and continue to provide ample new housing at affordable prices, expensive cities like San Francisco, Seattle, and New York have strayed from it and dramatically curbed their rate of outward expansion. Having failed to fully accommodate the demand for housing, the expensive cities have seen home values rise an order of magnitude, and population growth slow to a mere fraction of what their economies could otherwise support. In contrast to both expensive and expansive cities, legacy cities are those whose economic power has faded and therefore have far less need for increasing the amount of housing.
New housing in Austin has been more buoyant than in the other expansive cities, especially in the center, but the geographic pattern that expansive cities present is essentially similar to Austin’s. As of 2015, residential new construction sales were farthest below the 2000 benchmark in expansive cities’ interior suburbs, slightly less so near the center, and were largely above the 2000 benchmark near the metropolitan fringe.
The Steepening of the Housing Price Gradient
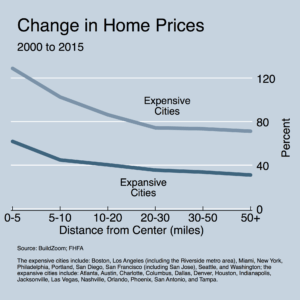
In contrast to residential new construction sales, home price appreciation in the expansive cities is greatest in the center and gradually declines with distance, in what amounts to a steepening of the housing price gradient.1 On average, appreciation has been greater in the interior suburbs than at the fringe.
Homebuilders would love nothing more than to build homes where prices are high and rising, suggesting robust demand. The steepening of the housing price gradient suggests that they should now be drawn more powerfully to the interior and, as a result, be more likely to seek land there and to confront – successfully or not – the difficulty of obtaining lots, whose scarcity is more acute in the metropolitan interior.2 By redirecting homebuilders’ attention towards the interior, the steepening of the housing price gradient has amplified their perception of a shortage of lots. It’s not that vacant land has grown scarcer, but that homebuilders are focusing on the places where it is hardest to find.
Why have residential new construction sales performed better in the center than in the interior suburbs? First, because the urban revival in the U.S. appears to be strictly a city center phenomenon. City by city data indicate that the changes in per capita income, educational attainment, racial composition and concentration of young adults which characterize the urban revival occur almost exclusively within 5 miles or less of the city center. Thus, the increased demand for an urban lifestyle appears to be confined almost exclusively to this range, and can help explain the exceptionally intense appreciation of home prices near the center, even in comparison to the innermost suburbs.
Second, whereas dense development in the heart of American cities is normal, go any farther out and it becomes taboo (with few exceptions, e.g. near transit centers). As a result, even though vacant lots are scarcest in the center, local land use rules typically allow denser construction in the center than in the interior suburbs.
Finally, the shortage of construction labor and the consequent increase in the cost of construction may affect the interior suburbs more than elsewhere. Homebuilders will only build if they anticipate a profit, and it may be the case that profit margins are lower in the interior suburbs than in both the center and at the metropolitan fringe – in the center because density is allowed, and at the metropolitan fringe because land there is substantially cheaper and the construction of entire subdivisions invokes economies of scale.
The Depletion of Vacant Lots
The housing price gradient has steepened in the expensive cities as well. Of course – as their namesake suggests – expensive cities have seen far greater increases in real home prices at all distances from the center, but prices have increased by a larger percent in the interior than farther out, and especially in the center. To some extent, the appreciation in expensive cities owes to how their economic bases have fared, but the key factor is their overall housing production – or lack thereof.
The housing supply in expensive cities is less responsive to rising home prices than in their expansive counterparts, first and foremost because they have slowed their pace of outward expansion to a crawl, and have – so far – failed to compensate with densification inside the developed footprint. While the expansive cities abound with new land and new gaps to fill in the freshly developed territory, the expensive cities rely on a supply of vacant lots that has become increasingly scant. As low-density development persists within a footprint that is slow to expand, the supply of vacant lots in the expensive cities will only get thinner.
Moreover, when homebuilders cannot build as many units as they would otherwise – because both land and density are limited – they typically opt for larger housing units that cater to a wealthier clientele, resulting in fewer new homes overall.
The systematic depletion of vacant lots in expensive cities makes it impossible to maintain past rates of housing production, except where densification is permitted, i.e. near the center. Indeed, residential new construction sales have surpassed the 2000 benchmark only within 5 miles of the center, and everywhere beyond 10 miles of the center they remain more than 50 percent beneath it. It should come as no surprise that the urban revival is manifesting itself in the expensive cities more powerfully than in the expansive ones. After all, the expensive cities have much more substantial urban cores, and offer a more viable urban lifestyle. It is more surprising, however, that even as the expansive cities are reverting to pre-recession growth trends, the expensive ones are not.
The dramatic slowing of outward expansion has depleted the expensive cities’ supply of vacant lots without introducing an alternative means to provide meaningful amounts of new housing. The depletion of vacant lots has been gradual, but although it is difficult to intuitively perceive a process that spans decades, we are suffering the consequences of the process today.
The gradual depletion of vacant lots, coupled with land use norms that prohibit densification, is severely restricting American cities’ capacity to produce new housing. Absent a dramatic change of land use norms to facilitate densification they will continue to depend on outward expansion for providing meaningful housing growth, and their capacity to build new homes in the interior will become increasingly limited, with one exception. Ironically, current land use norms are such that new housing in the interior is most palatable right at the center. Perhaps there is more profound truth than ever to the old real estate mantra: location, location, location.
Downloads:
Metro-by-metro charts of change in residential new construction sales, by distance from center:
Metro-by-metro charts of change in home prices, by distance from center:
Notes:
- Home prices near the center have proven more resilient in the face of the housing cycle: during the boom years home prices rose uniformly regardless of distance to the center but, during the bust, they fell more sharply farther out, and since then they have recovered more forcefully closer in.
- Cities that experienced the last decade’s housing boom more forcefully also saw their stock of vacant lots depleted at a faster rate than it would have otherwise. The housing boom of the last decade acted as a catalyst for the consumption of vacant lots, especially towards the metropolitan fringe.

Leave a Reply