
BuildZoom has an array of classifiers applied to building permits, which allows us to track trends across different segments of the construction market. The ‘new construction’ classifier has a high correlation (r=.77) with the US Census’ estimate for monthly expenditures on private residential construction.
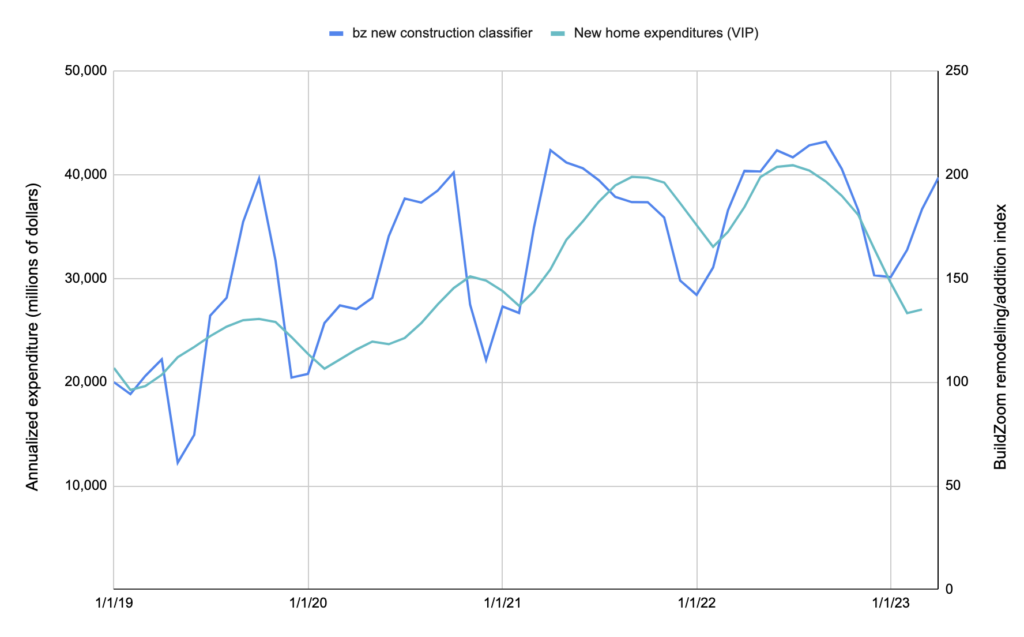
Taking a look at April ’23 permit issuance for ‘new construction,’ we saw a slight uptick over March ’23. From a year-over-year standpoint, growth moved from -22% in March to -20% in April.
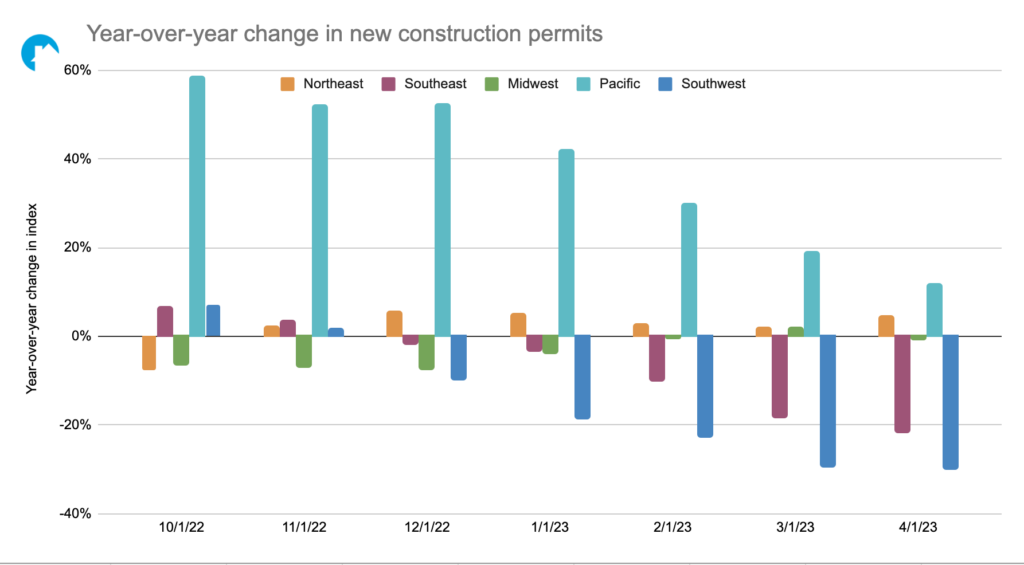
There are several advantages to using our own permit data vs the US Census’ index; one of the primary advantages is we’re able to drill-down regionally, whereas the US Census’ estimates are national.
Breaking things down from a regional standpoint, we see a decline in year-over-year growth across the board, however there continues to be positive annual growth in the Pacific and Northeast regions, while most of the negative growth is coming from markets in the Southwestern and Southeastern regions.
Here’s a further breakdown of what we’re seeing in new construction across the US:
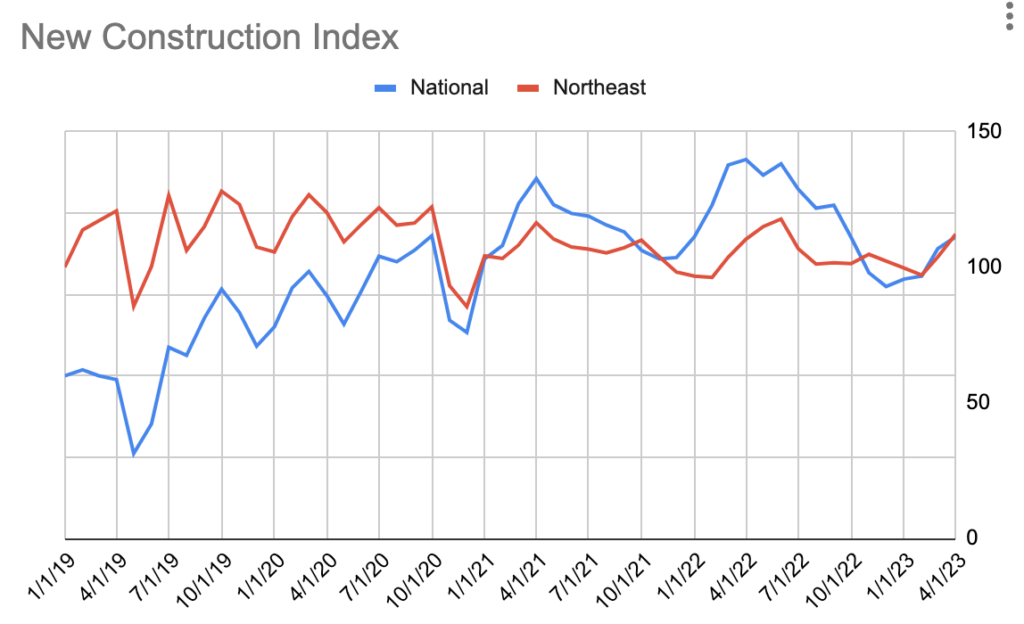
Northeast
Monthly growth in construction permitting has been on the upswing since Feb ’23 and that trend continued through April.
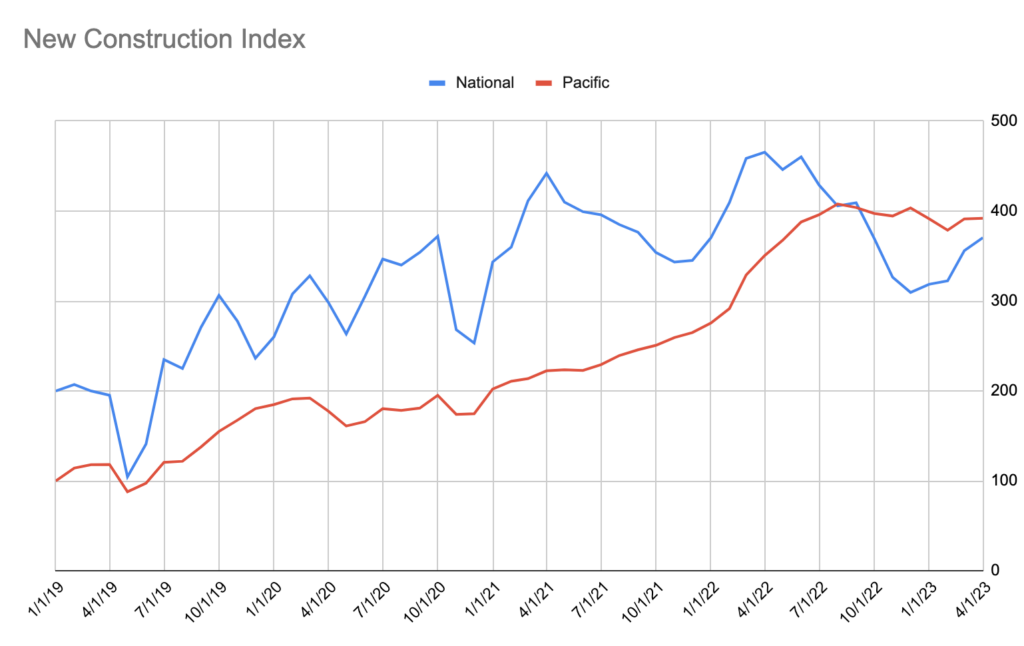
Pacific
Pacific markets were flat over March ’23, a trend that has more or less tracked since July ’22, after several years of steady growth.
The South
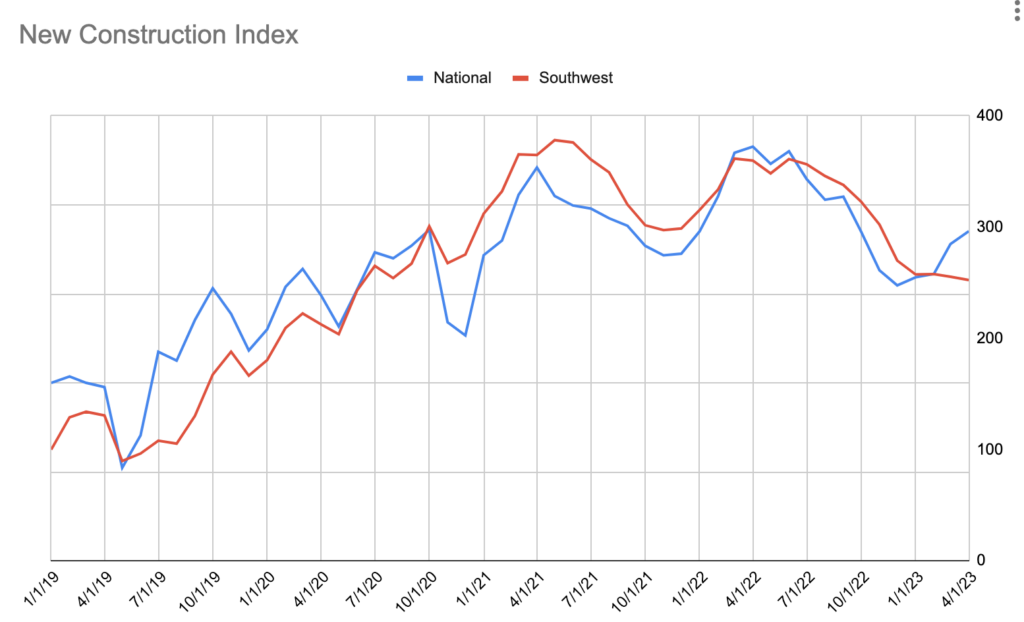
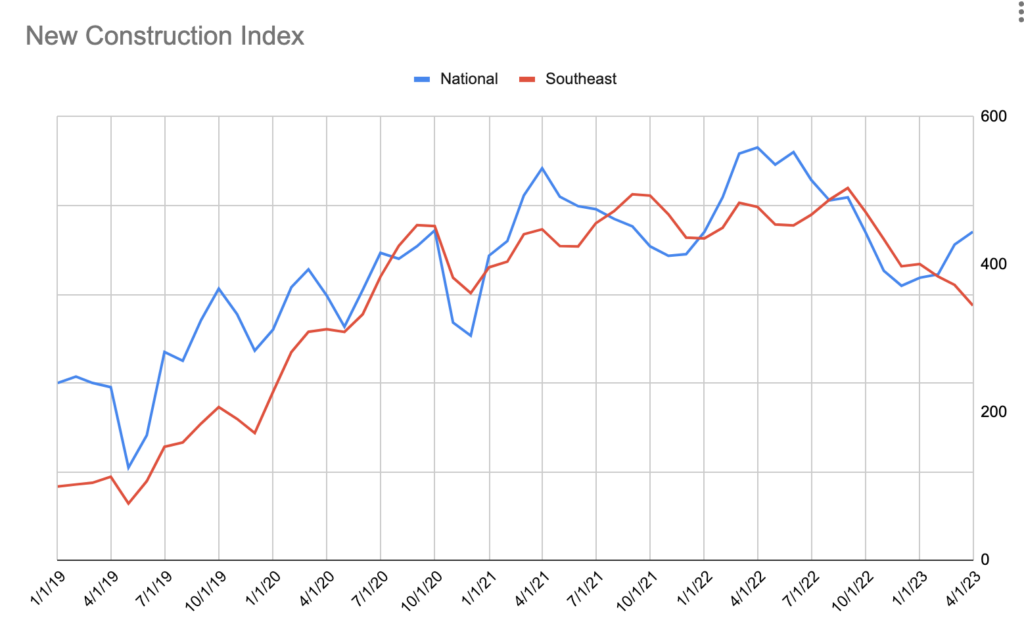
Southwestern markets continued to remain flat in April ’23; Southeastern markets continued to drop sharply since their peak in Sep ’22.
Midwest and Rocky Mountains
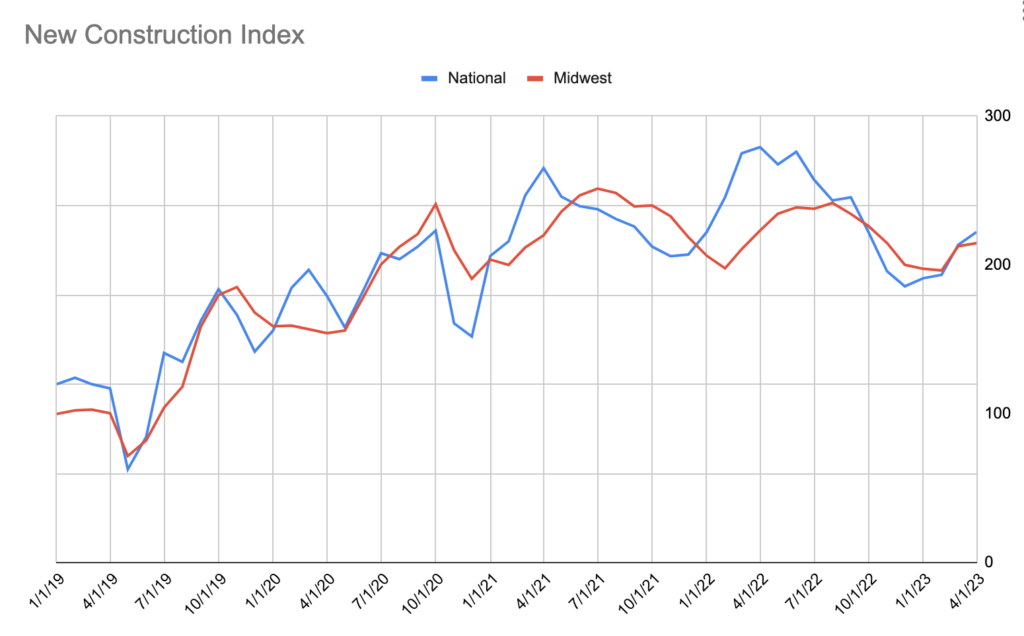
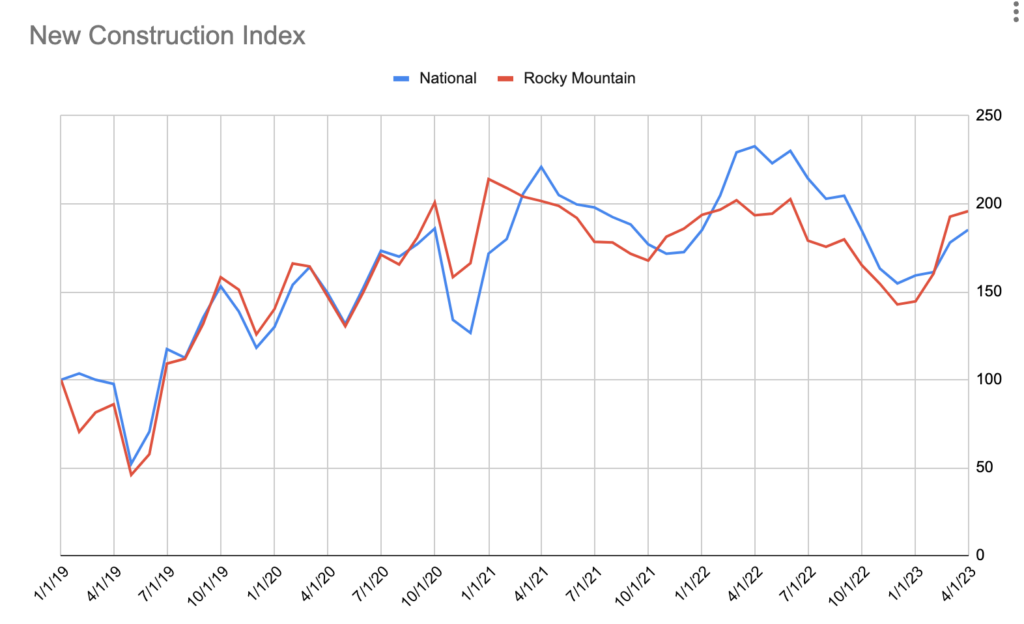
Midwestern markets were flat over March ’23, while the rapid growth that markets in the Rocky Mountain region have seen since the beginning of the year slowed.


Leave a Reply